Tech Tips: How to export multiple results for parameter studies
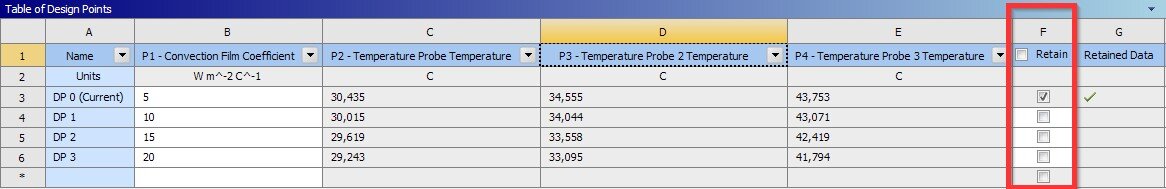
Then you can open Mechanical for a retained design point and look at the result plots etc.
But sometimes you would perhaps just want to export some results to a text file for each design point. This can in many cases be achieved by using commands objects. Take the following transient thermal analysis as an example.
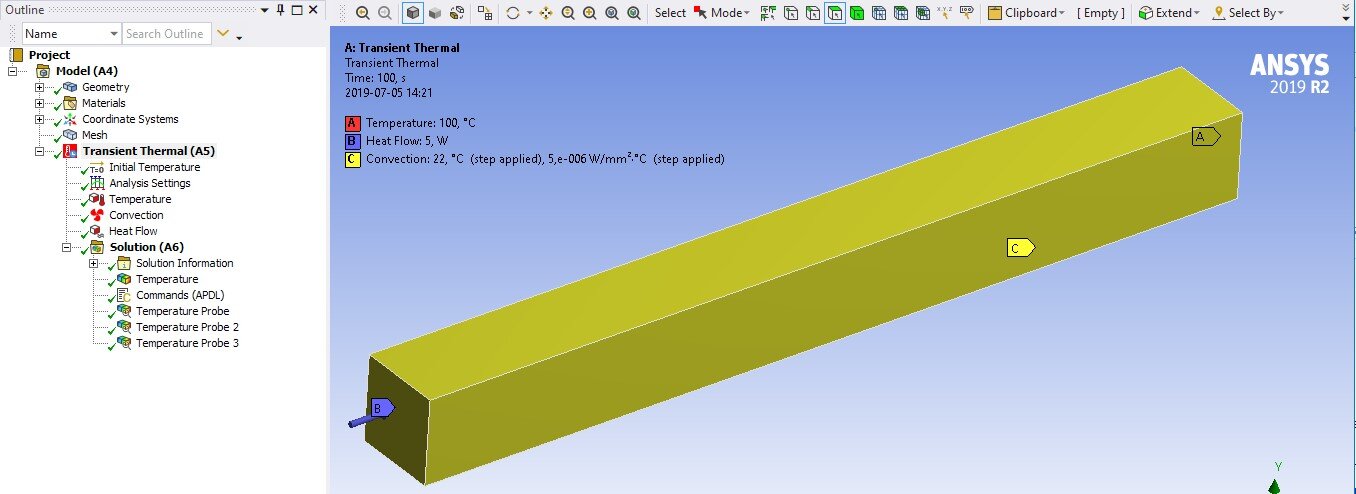
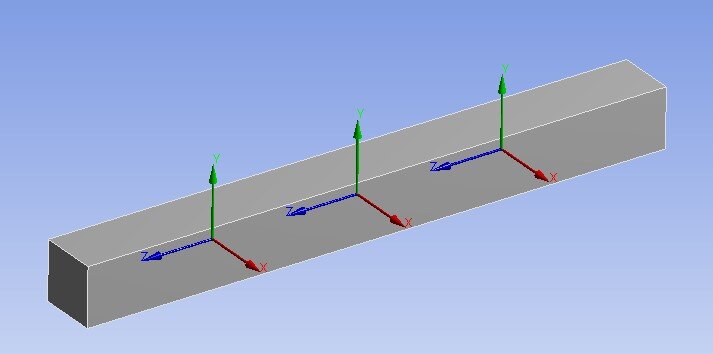
In this model we have three coordinate systems defining points for which we want to track the temperature over time.
For a single analysis this can be achieved by using Temperature Probes as shown below.
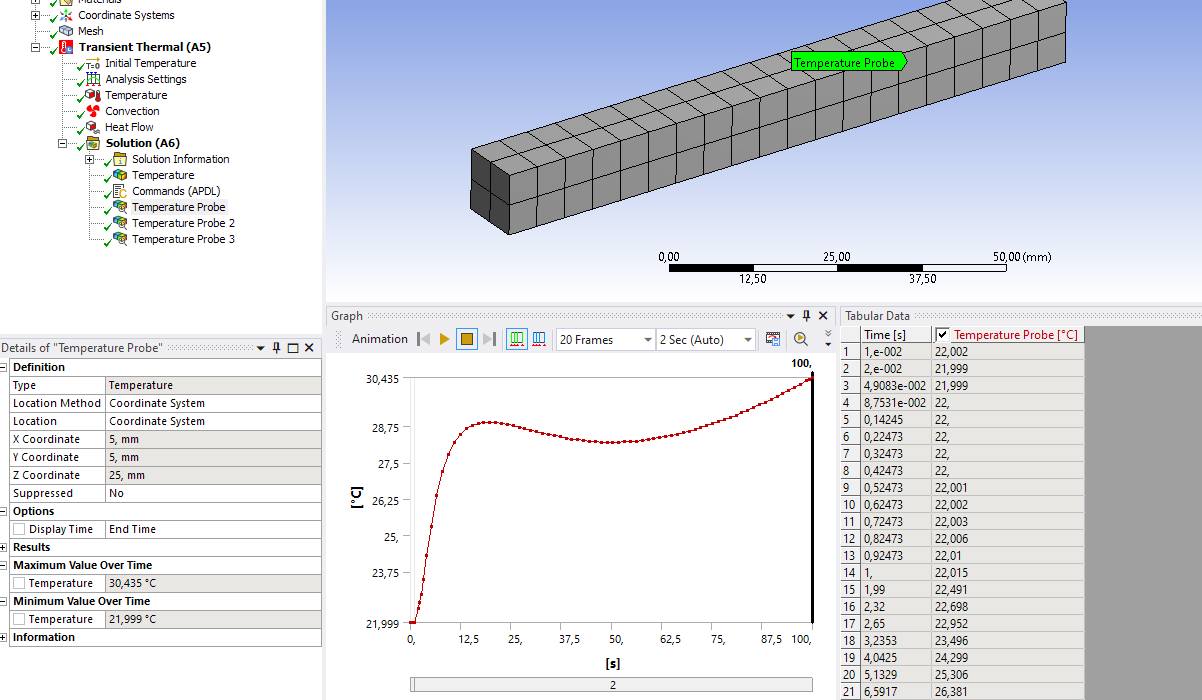
But it is a bit of a hassle to retaining all design points, opening each one and export the data. So, if we extract the data using a commands object instead, we can also automatically write the results to a text file.
First, we need to do some preparations. We need to define an “APDL Name” for each coordinate system so we can use that to extract the temperature for that position.
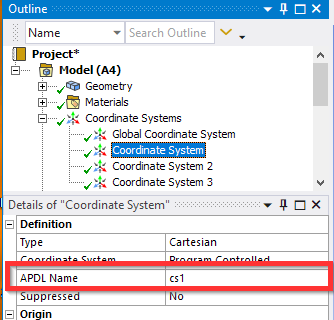
In this example I have just used the names “cs1”, “cs2” and “cs3” so I can easily create a loop in the commands object.
Under Solution we can then add a commands object with the following commands.
/post26 !Use Time-History postprocessor
file,file,rth !Read file.rth
*do,i,1,3 !Loop over three coordinate system
csys,cs%i% !Change active coordinate system to cs1, cs2, cs3 and so on
mynode=node(0,0,0) !Get node number for node closest to origin
nsol,2,mynode,temp !Get teperature results for node
store,merge !Store the results in the database
*get,size,vari,,nsets !Get number of timesteps
*dim,temps_cs%i%,array,size ! Create array parameter
vget,temps_cs%i%(1),2 ! Store time-history data of variable 2 into temps_cs1 *enddo !End loop
*dim,timearr,array,size !Define array for time values
vget,timearr(1),1 ! Store time values
! Search the location of the first folder name starting with ‘dp’
dpFolder = ‘dp’
dpLoc = STRPOS(_wb_SolverFiles_dir(1),dpFolder)
! Get the 6 characters after dp
CutPath = STRSUB(_wb_SolverFiles_dir(1),dpLoc+3,6)
! Get the string position of the next directory separator
DirSepLoc = STRPOS(CutPath,”)
! Remove the characters starting from the directory separator
dpNb = STRSUB(CutPath,1,DirSepLoc-1)
*cfopen,’%_wb_userfiles_dir(1)%Temperature_curves_dp%dpNb%’,csv !Write results to Temperature_curves.csv
*vwrite
(‘Time’,’;’,’Temp_cs1′,’;’,’Temp_cs2′,’;’,’Temp_cs3′)
*vwrite,timearr(1),temps_cs1(1),temps_cs2(1),temps_cs3(1) ! Write array in given format to file (f12.3,’;’,f12.3,’;’,f12.3,’;’,f12.3)
*cfclose
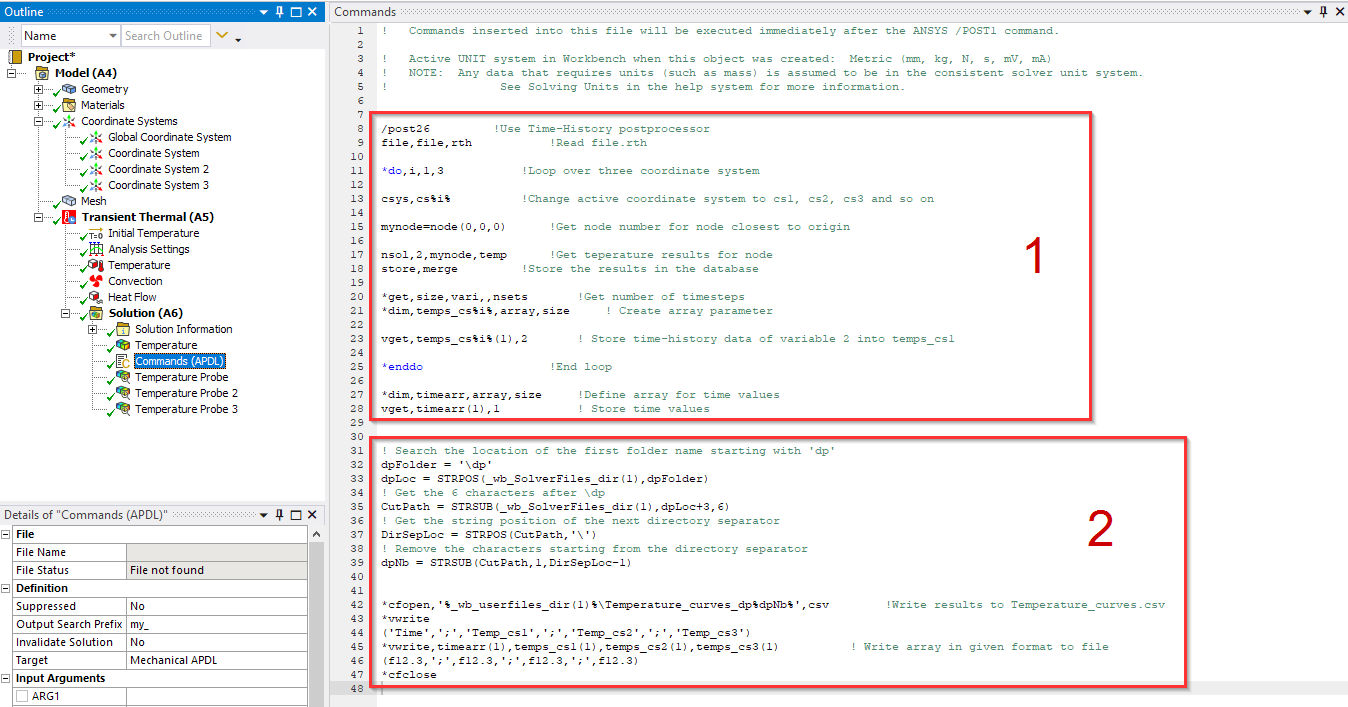
Part 1 of the commands stores the results data and part 2 writes it to a .csv file. With the first section of part 2 we can get the design point number and append that to the file name. Then we save the file in the “user_files” folder for the project. So, when then parameter study has been solved, we end up with the following files.
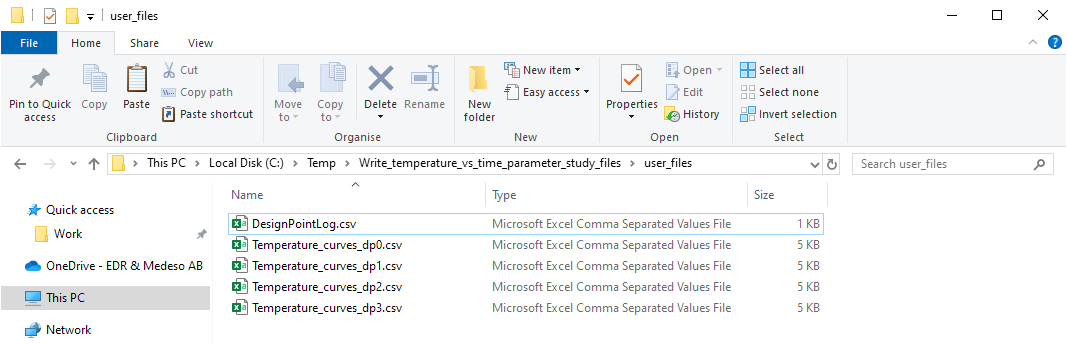
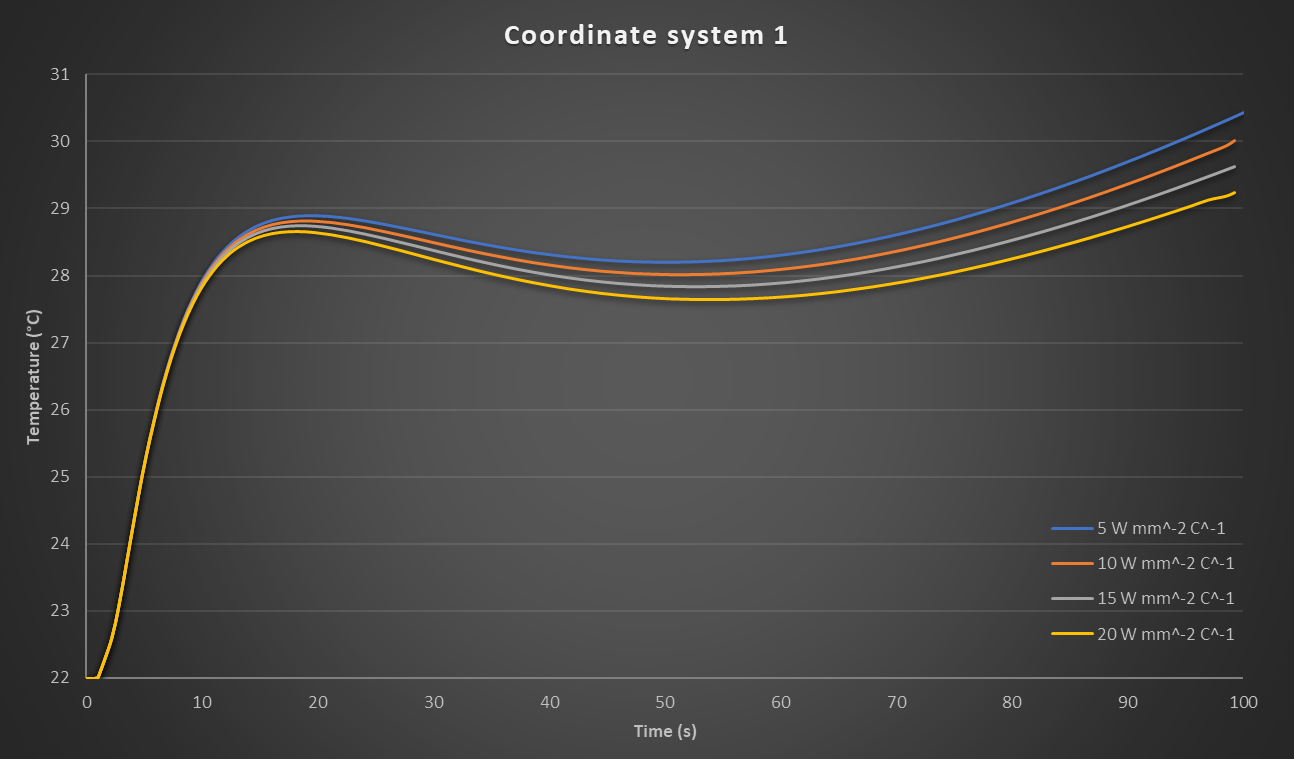
This makes it easy to investigate the temperature vs time behaviour for different design points.

